Instrumentation & Tracing
Zephyr provides two complementary subsystems for analyzing runtime behavior. While both extract data from a running system, they operate at different levels and answer different questions.
Comparison
Feature |
Tracing |
Instrumentation |
|---|---|---|
Core Question |
When did it happen? (Sequence & Timing) |
What functions executed? (Call graph & flow) |
Level |
RTOS-aware (high-level events) |
Compiler-level (all functions) |
Data Type |
Discrete Events (Context switch, IRQ entry, Semaphore take) |
Function entry/exit events with timestamps |
Visual Output |
Timeline / Gantt Chart (e.g., TraceCompass, Perfetto) |
Function call tree / Perfetto |
Manual Setup Required |
Minimal (Kconfig only) |
None (automatic compiler insertion) |
Overhead |
Low to Medium |
Higher (every function call) |
When to Use What
Use the Tracing subsystem (subsys/tracing) when you need RTOS-aware event tracing with structured event APIs. Best for tracking kernel events like thread switches, semaphore operations, and IRQ handling with minimal overhead. Supports backends like CTF, SysView, and Percepio Tracealyzer.
Use the Instrumentation subsystem (subsys/instrumentation) when you need a
detailed view of function-level execution flow without adding manual trace
points. The compiler automatically instruments function entry/exit using GCC’s
-finstrument-functions, making this ideal for capturing complete call graphs
and understanding code flow at the function level.
Tracing
Tracing records the exact sequence of executable events as they occur on the timeline. It preserves the temporal relationship between different parts of the system.
Useful for:
Debugging Concurrency: Visualizing race conditions, deadlocks, and priority inversions between threads.
Latency Analysis: Measuring the exact duration an Interrupt Service Routine (ISR) blocks critical threads.
Flow Verification: Confirming that the sequence of hardware interactions (e.g., “SPI transaction starts” -> “GPIO toggles”) happens in the correct order.
Instrumentation
Instrumentation captures function entry and exit events automatically through compiler instrumentation. Unlike tracing which focuses on RTOS events, instrumentation records virtually every function call without code changes.
Useful for:
Complete Call Graphs: Reconstructing the full function call tree to understand complex execution flows.
Automated Analysis: Capturing function traces without manually adding trace points throughout the codebase.
Detailed Flow Analysis: Understanding the exact path taken through the code at the function level.
Important Considerations:
Higher overhead than tracing (instruments every function)
Requires GCC with
-finstrument-functionsIncreases code size and stack usage
Use trigger/stopper functions to limit recording to specific code regions
Exclude performance-critical functions via Kconfig to reduce overhead
Tracing Example with Trace Compass
This example uses the tracing_sample from the Zephyr tracing subsystem to generate a CTF trace and visualize it in Trace Compass.
Note
Trace Compass needs both the trace data file and the metadata file that
describes the CTF format. The metadata file is located at
zephyr/subsys/tracing/ctf/tsdl/metadata in the Zephyr source tree.
Both files must be in the same directory to open the trace.
Build and run the tracing sample:
host:~$ west build -b native_sim samples/subsys/tracing -- \
            -DCONF_FILE=prj_native_ctf.conf
host:~$ ./build/zephyr/zephyr.exe -trace-file=traces/channel0_0
After the run completes (or is cancelled), the traces/ directory contains
the trace data file.
Open Traces
Trace Compass is an open-source trace viewer from the Eclipse Foundation. It can visualize CTF traces as timelines and Gantt charts.
To make Trace Compass aware of Zephyr-specific events (thread switches, ISRs, semaphore operations), you need to install the Zephyr parser from the zephyr-tracecompass-parser repository. The following steps guide you through the setup process. Once setup, you can view all Zephyr traces (generated by a native_sim run or via hardware).
1. Install Scripting Support
Trace Compass requires scripting extensions to run the Zephyr parser. Install the following modules via Tools > Add-ons…:
Trace Compass Scripting (Incubation)
Trace Compass Scripting Python (Incubation)
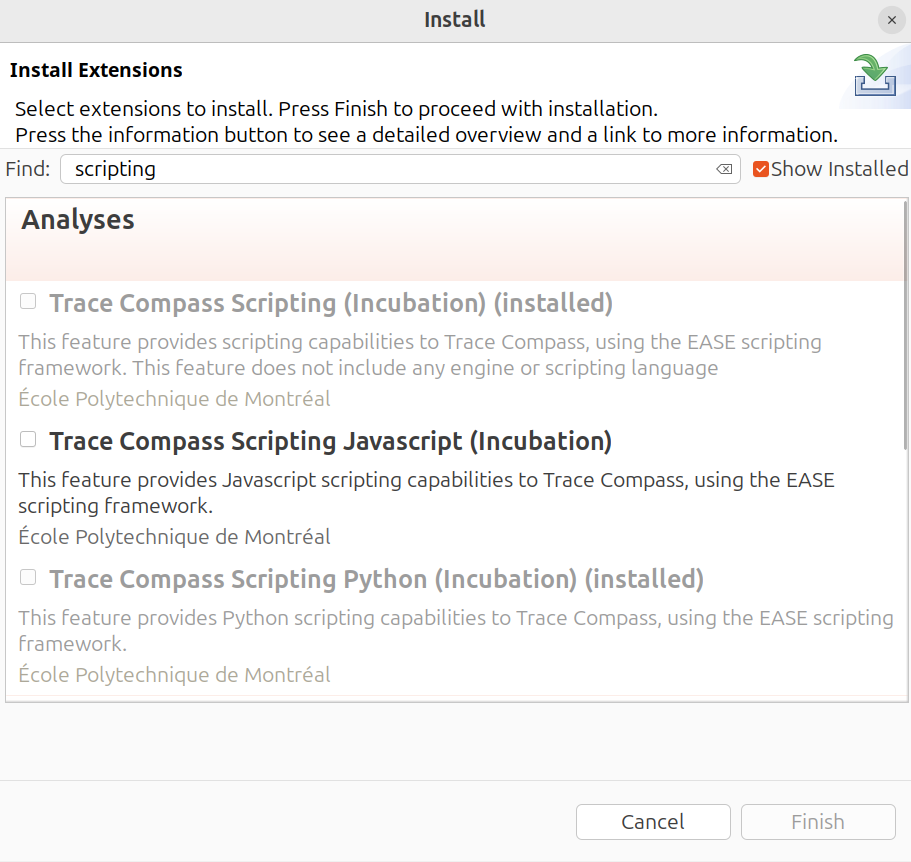
Installing Trace Compass Scripting and Python modules
2. Configure Script Path
Clone the parser repository and import the script:
host:~$ git clone https://github.com/ostrodivski/zephyr-tracecompass-parser.git
Configure the Python interpreter path in Preferences > Scripting > Python Scripting (using Py4J). Set it to your Python 3 executable:
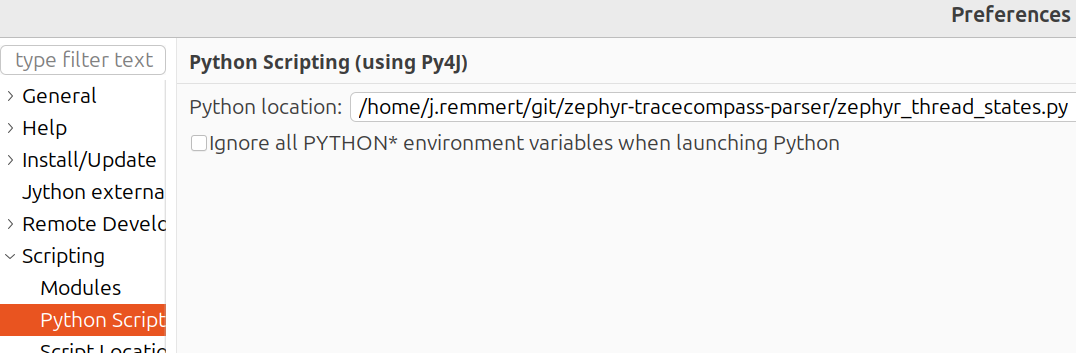
Setting the Python interpreter path
3. Import the Parser Script
In Trace Compass, right-click in the Project Explorer and select Open Trace…:
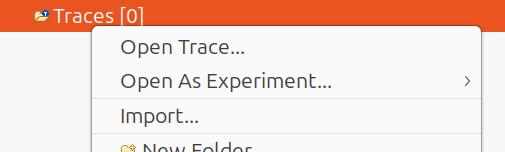
Opening the file browser to import the parser script
Navigate to the cloned repository and select zephyr_thread_states.py:
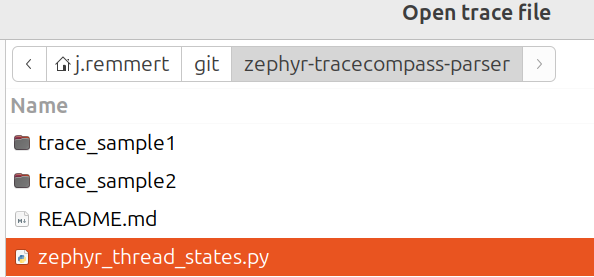
Selecting the Zephyr parser script
The script will appear in your Traces folder:
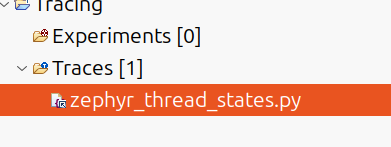
Parser script successfully imported
4. Import the CTF Trace
Right-click in the Project Explorer and select Import…:
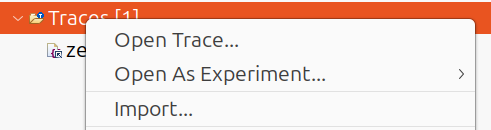
Import menu to add CTF trace files
In the Trace Import dialog, select your traces/ directory containing both
channel0_0 (trace data) and metadata (CTF format description) files:
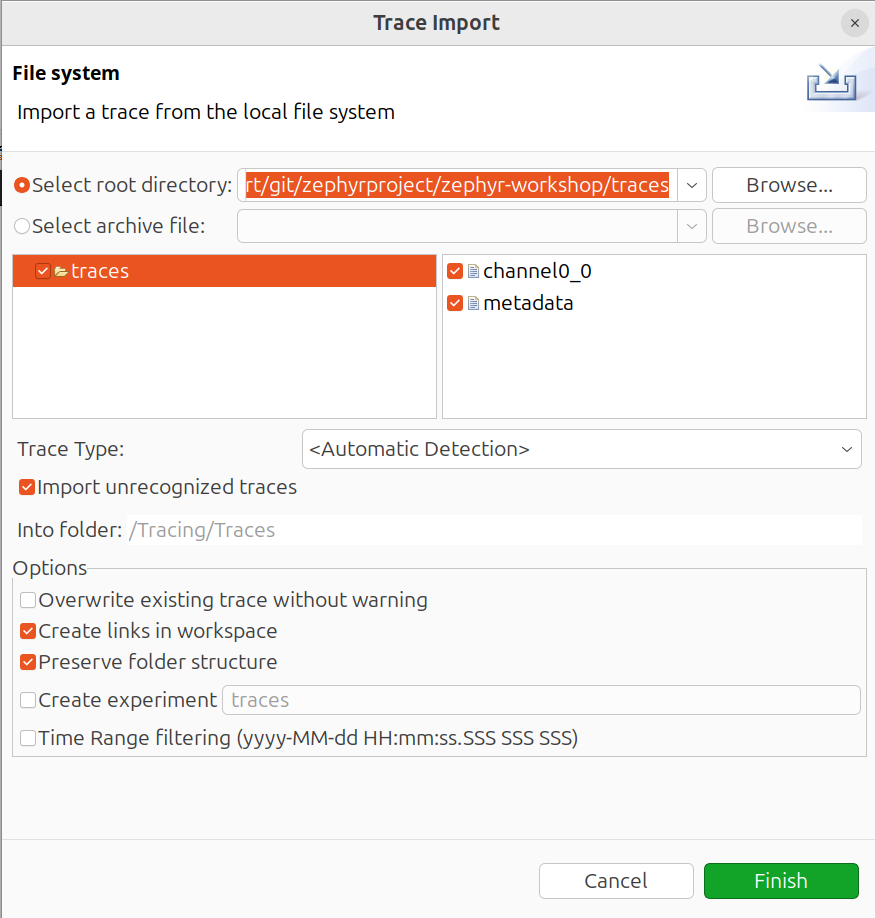
Importing the traces directory with channel0_0 and metadata files
5. Open the Trace
Before running the parser, you must explicitly open the trace file. In the
Project Explorer, right-click on the imported trace (e.g., channel0_0) and
select Open:
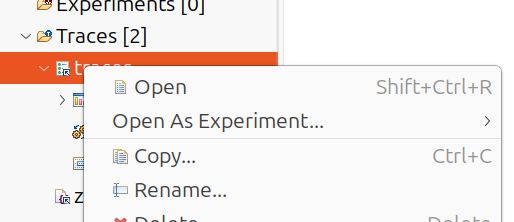
Right-click and select Open to open the trace
Now the events in the traces field should already be visible.
6. Run the Parser
Run the zephyr_thread_states.py script to enable Zephyr-specific event
parsing. Right-click the script and select Run As… > Ease Script:
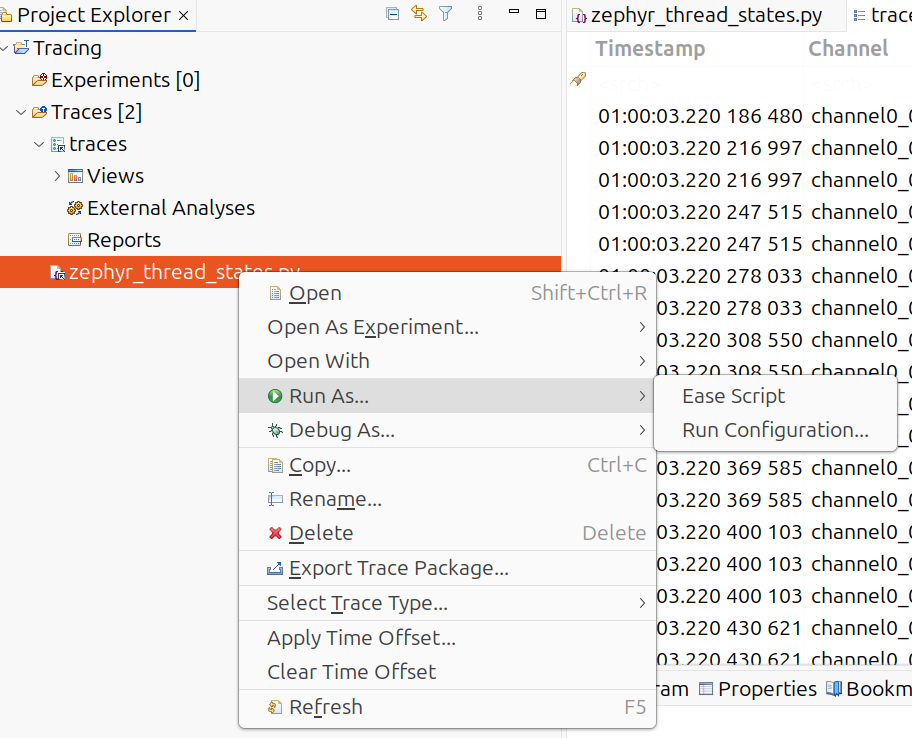
Running the zephyr_thread_states.py script
Note
If the script fails with “Could not setup Python engine” or Py4J errors, try running with Jython instead: Run As… > Run Configuration… > Jython
7. View the Results
After running the script, a new Zephyr Comprehensive Timeline tab will open, showing thread states, interrupts, and kernel events:

Zephyr Comprehensive Timeline view opened
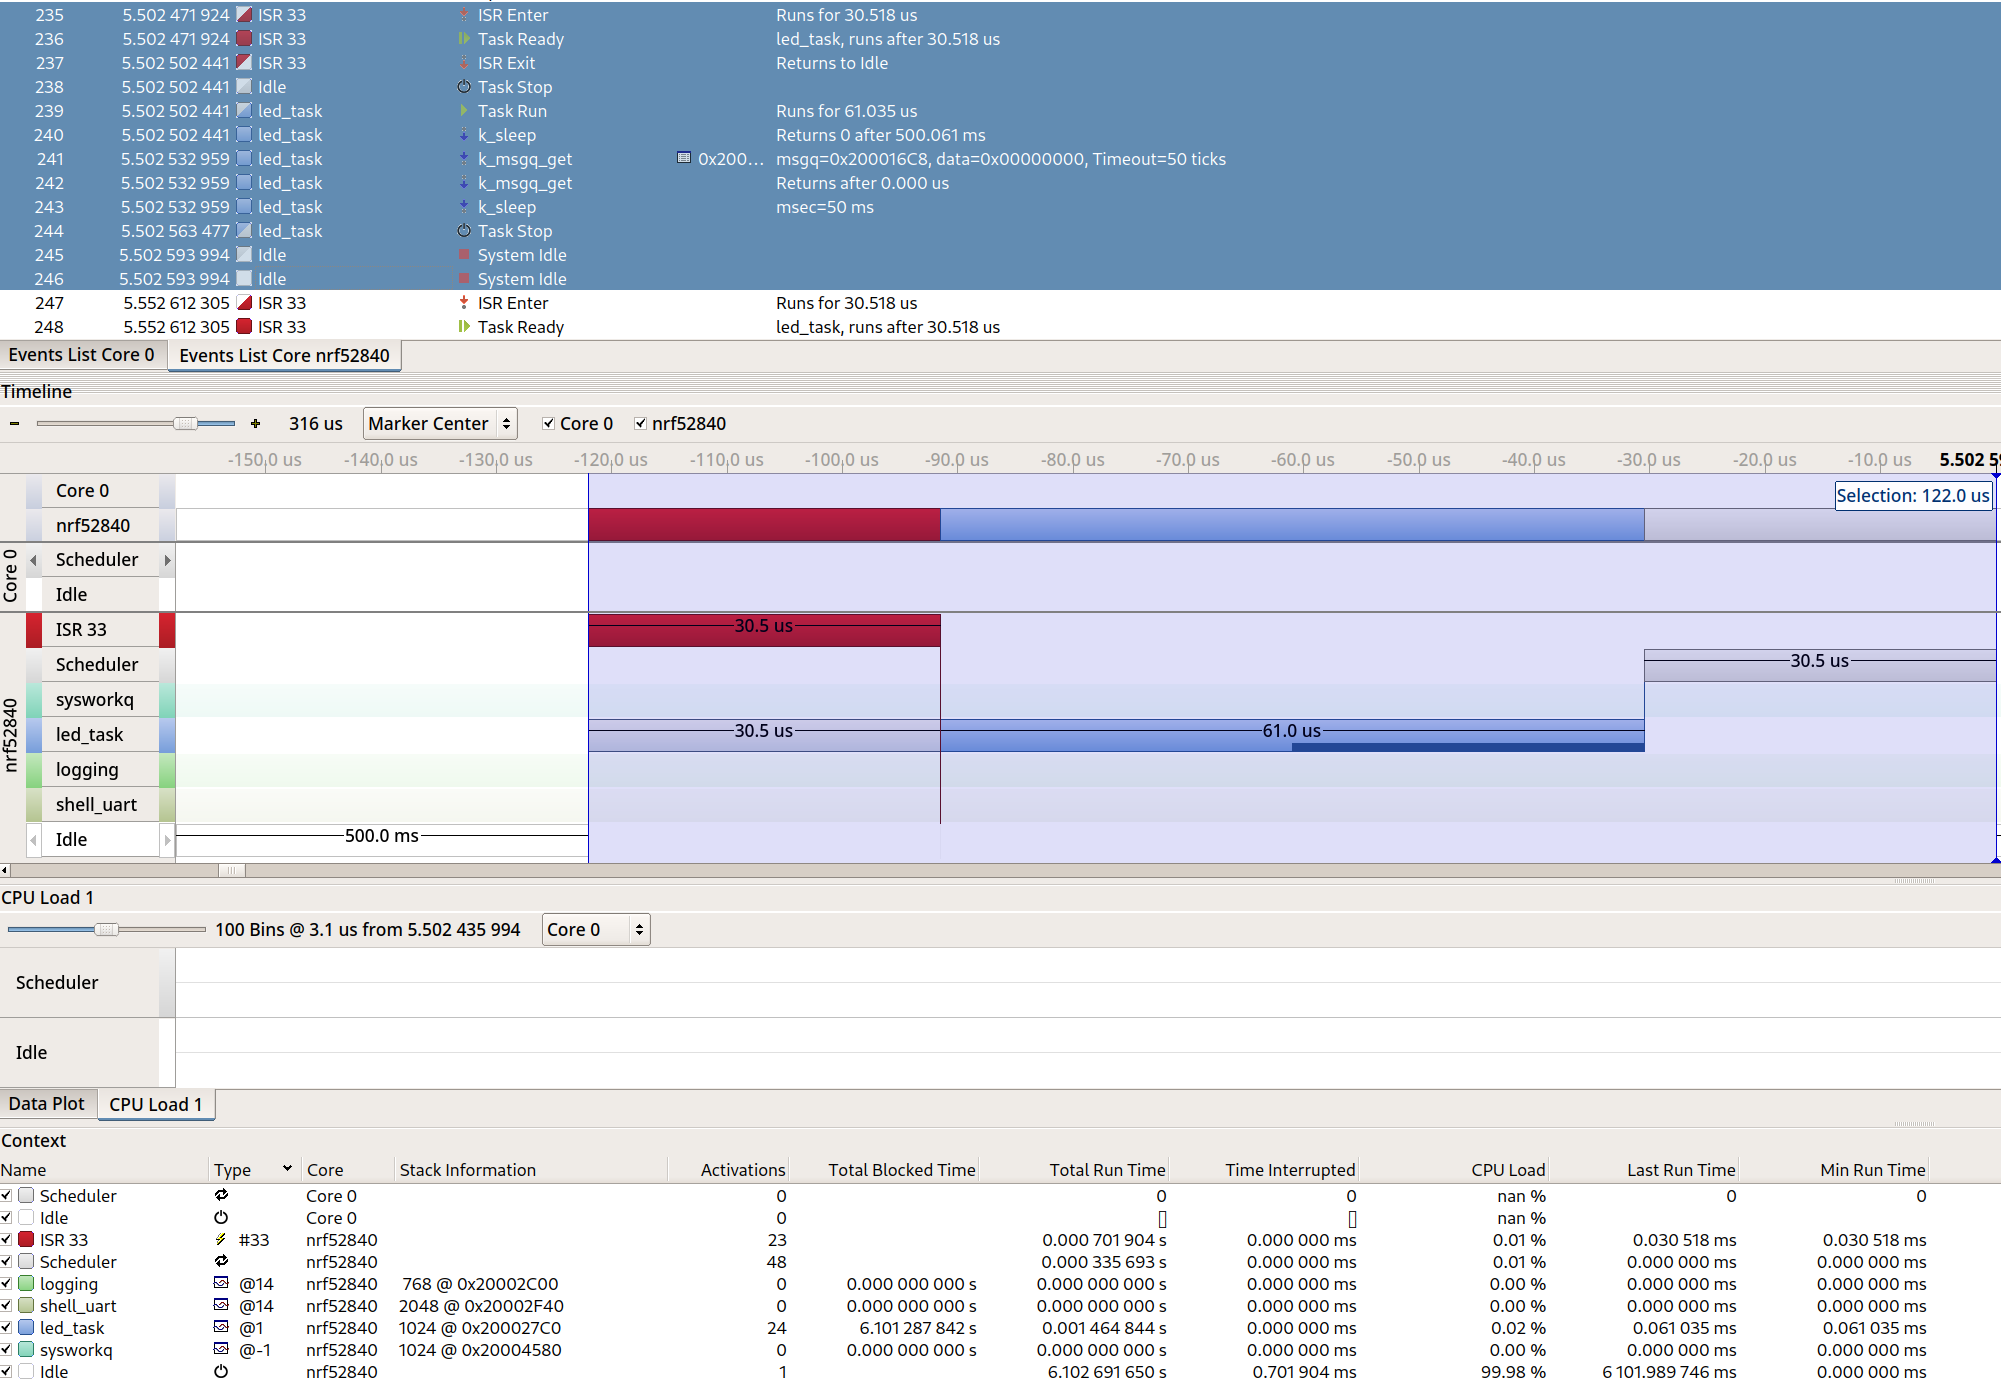
The trace visualization shows thread scheduling, ISR execution, and GPIO
operations in both table and Gantt chart views. The trace is from a
nrf52840dk evaluation board where the traces have been collected via usb
(see example below):
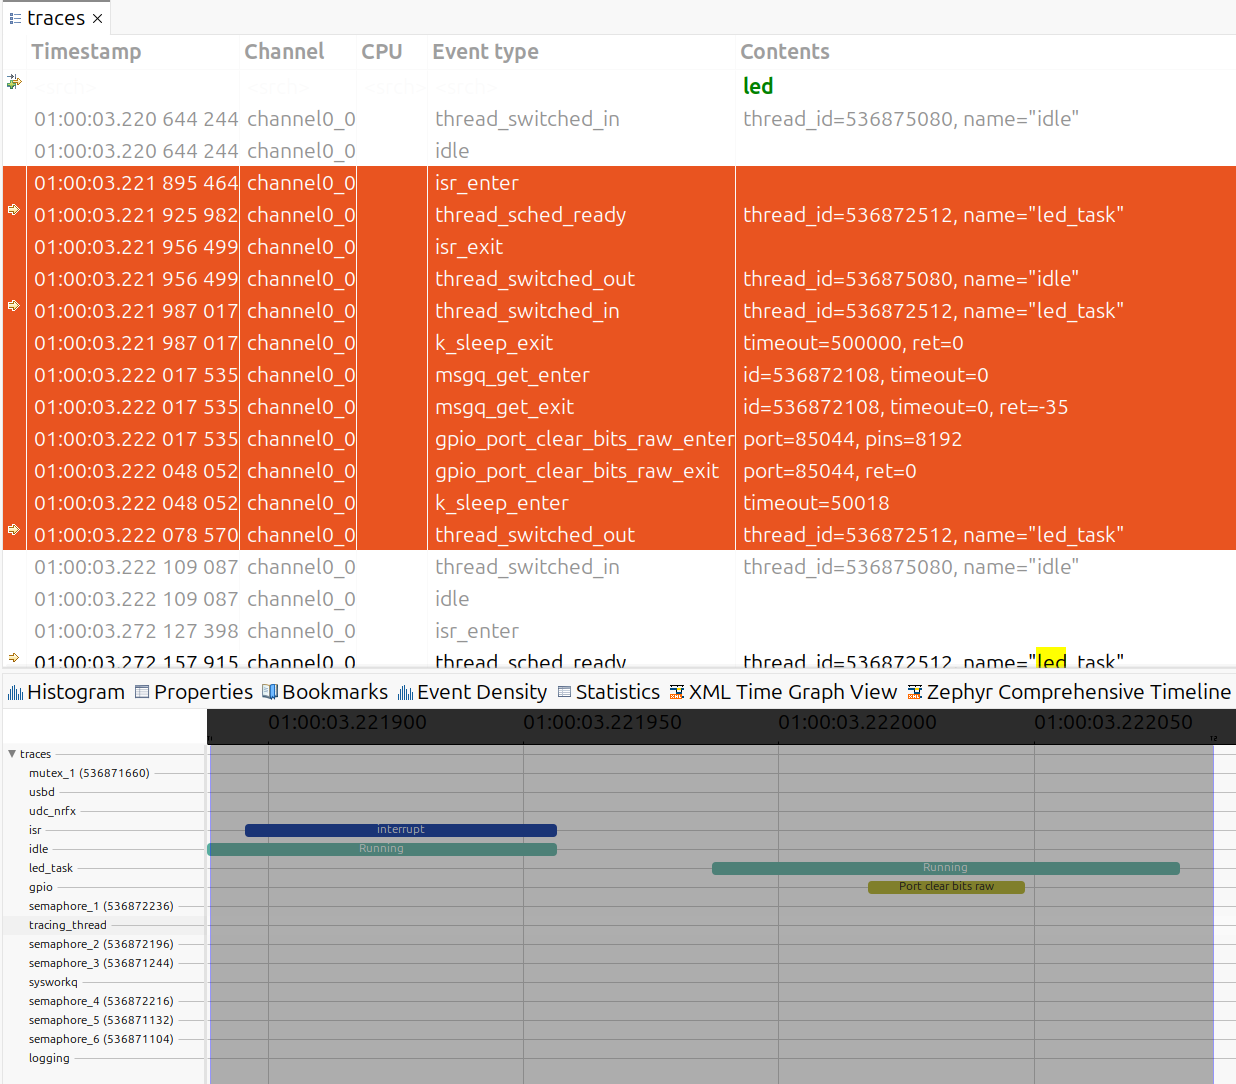
Trace Compass showing thread scheduling, ISR execution, and GPIO operations
The selected trace and marked events above represent the toggle of the LED on a Nordic nRF52840dk board with the application example.
native_sim
The workshop app includes prj_native_ctf.conf:
Build and run:
host:~$ west build -b native_sim app -p -- -DEXTRA_CONF_FILE=prj_native_ctf.conf
host:~$ mkdir -p traces
host:~$ ./build/zephyr/zephyr.exe -trace-file=traces/channel0_0
Stop the application after a few seconds. The traces/ directory now contains
the trace data file.
HW via USB
For physical boards like the nrf52840dk, the USB backend provides a clean way to capture CTF traces without interfering with the console UART. The board enumerates as a USB device and streams trace data to the host.
The workshop app includes prj_usb_ctf.conf. Simply enable the
TRACING_USB_MODULE to automatically configure USB device initialization:
Build and flash to the board:
host:~$ west build -b nrf52840dk/nrf52840 app -p -- -DEXTRA_CONF_FILE=prj_usb_ctf.conf
host:~$ west flash
Connect the board’s USB port to your host. The board will enumerate as a USB device.
USB Permissions (Linux):
On Linux, accessing USB devices requires proper permissions. The workshop
includes a udev rule file at util/50-zephyr-tracing.rules. Install it to
allow non-root access:
host:~$ sudo cp util/50-zephyr-tracing.rules /etc/udev/rules.d/
host:~$ sudo udevadm control --reload-rules
host:~$ sudo udevadm trigger
Finding the VID and PID:
Use lsusb to find your device’s Vendor ID (VID) and Product ID (PID):
host:~$ lsusb
Bus 003 Device 082: ID 2fe3:0001 NordicSemiconductor USBD sample
The format is ID VID:PID. In this example:
VID =
0x2FE3(Nordic Semiconductor)PID =
0x0001(Zephyr USB device)
These values are configured in the Zephyr USB device stack and may vary by board.
Capture the trace data:
host:~$ python3 ../zephyr/scripts/tracing/trace_capture_usb.py -v 0x2FE3 -p 0x0001 -o traces/channel0_0
Let it run for some time, then press CTRL+C to stop. The traces/
directory now contains the trace data file and can be opened in Trace Compass.
HW via J-Link RTT + SystemView
For physical boards like the nrf52840dk, the SEGGER SystemView backend
provides real-time tracing via J-Link RTT (Real-Time Transfer). SystemView
visualizes thread scheduling, interrupts, and kernel events with minimal
overhead.
Note
SEGGER SystemView requires a license for commercial applications. For educational and evaluation purposes, it is free to use.
The workshop app includes prj_sysview_rtt.conf:
Build and flash to the board:
host:~$ west build -b nrf52840dk/nrf52840 app -p -- -DEXTRA_CONF_FILE=prj_sysview_rtt.conf
host:~$ west flash
SystemView Software Installation:
Download and install SEGGER SystemView from the SEGGER website. Ensure the J-Link software
is also installed and JLinkExe is in your system PATH.
Stream the trace data:
Connect the
nrf52840dkto your host via USB (J-Link debugger)Open SystemView and select Target > Recorder Configuration
Set the interface to RTT and device to nRF52840_xxAA
Click Start to begin recording
SystemView should show a stream of the trace, which you can stop at any time
SystemView with thread scheduling, ISR execution, and kernel events
The screenshot below shows a typical SystemView trace from the example app running on the nrf52840dk. The timeline displays thread execution, interrupts, and kernel events with precise timing information: